

Core Web Vitals Explained: LCP, INP and CLS in Plain English
Have you ever tapped a button on a website only for the page to jump, so you hit an ad instead? Or waited for a hero image that seemed to take forever to appear? Google built Core Web Vitals to measure exactly those frustrations. They turn the vague idea of a “good user experience” into three numbers you can track and improve.
In this guide, we’ll explain each metric in plain English, show the thresholds Google uses and walk through the fixes that make the biggest difference, especially for WordPress sites.
Key Takeaways
- Core Web Vitals are three Google metrics that measure loading (LCP), responsiveness (INP) and visual stability (CLS).
- Good scores are LCP of 2.5 seconds or less, INP of 200 milliseconds or less and CLS of 0.1 or less, measured at the 75th percentile of real visits.
- INP replaced First Input Delay (FID) as a Core Web Vital in March 2024.
- Google uses Core Web Vitals as part of its page experience signals, but relevance and content quality still matter far more.
- Most improvements come from optimizing images, reducing JavaScript, reserving space for content and using good hosting and caching.
What Are Core Web Vitals?
Core Web Vitals are a set of user-centered performance metrics defined by Google’s Chrome team as part of the broader Web Vitals initiative launched in 2020. They focus on three aspects of how a page feels to a visitor:
- Loading: how quickly the main content appears, measured by Largest Contentful Paint (LCP).
- Interactivity: how quickly the page responds when someone clicks, taps or types, measured by Interaction to Next Paint (INP).
- Visual stability: how much the layout unexpectedly moves around, measured by Cumulative Layout Shift (CLS).
Google rolled Core Web Vitals into its ranking systems through the page experience update, which began on mobile in June 2021 and extended to desktop in early 2022. Page experience also considers HTTPS, mobile-friendliness and the absence of intrusive interstitials.
The Three Metrics and Their Thresholds
| Metric | Measures | Good | Needs improvement | Poor |
|---|---|---|---|---|
| LCP | Loading | 2.5 s or less | 2.5 s to 4 s | Over 4 s |
| INP | Responsiveness | 200 ms or less | 200 ms to 500 ms | Over 500 ms |
| CLS | Visual stability | 0.1 or less | 0.1 to 0.25 | Over 0.25 |
Google evaluates these at the 75th percentile of page loads, split by mobile and desktop. In other words, at least three out of four visits should have a good experience for a page to pass.
Largest Contentful Paint (LCP)
LCP measures the time from when a user starts loading the page until the largest image or text block in the viewport is rendered. On most pages, that’s a hero image, a featured image or a large heading. It’s a good proxy for the moment a visitor feels the page has “loaded.”
LCP has four sub-parts worth knowing: Time to First Byte (TTFB), resource load delay, resource load duration and element render delay. Diagnosing which part is slow tells you whether to look at your server, your images or your render-blocking code.
Interaction to Next Paint (INP)
INP observes every click, tap and keyboard interaction during a visit and reports one of the slowest. It measures the time from the interaction until the browser can paint the next frame showing the result. INP officially replaced First Input Delay (FID) on March 12, 2024, because FID only measured the delay before the first interaction was processed and missed sluggishness later in the visit.
Poor INP is almost always caused by too much JavaScript running on the main thread: heavy themes, page builders, chat widgets, tracking scripts and large frameworks.
Cumulative Layout Shift (CLS)
CLS measures how much visible content moves unexpectedly while the page is open. Every time an element shifts without user input, the browser calculates a layout shift score based on how much of the screen moved and how far. CLS reports the largest burst of shifts during the visit.
Common culprits include images without dimensions, ads and embeds that load late, web fonts that swap in with different sizes and banners injected at the top of the page.
How to Measure Core Web Vitals
There are two kinds of data, and you need both.
Field data (real users)
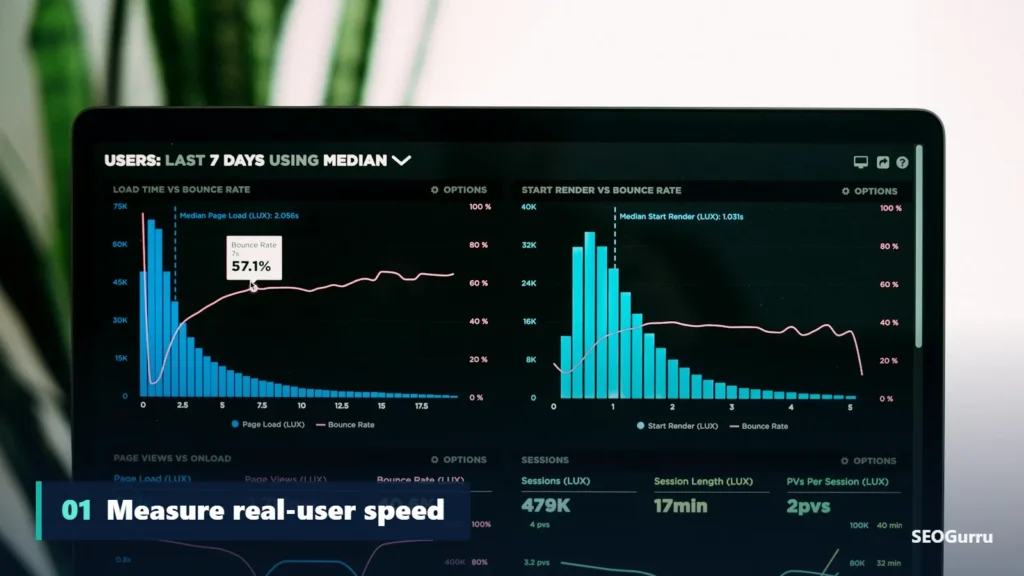
Field data comes from the Chrome User Experience Report (CrUX), which collects anonymized performance data from opted-in Chrome users. It’s what Google uses for ranking. You’ll find it in:
- Google Search Console, under the Core Web Vitals report, grouped by similar URLs
- PageSpeed Insights, in the “Discover what your real users are experiencing” section
- CrUX Dashboard and CrUX API, for historical trends
Lab data (simulated tests)
Lab data comes from a controlled test of a single page load. It’s ideal for debugging because results are reproducible. Tools include:
- Lighthouse, built into Chrome DevTools
- PageSpeed Insights, which runs Lighthouse for you
- WebPageTest, for detailed waterfalls and filmstrips
- The Performance panel in Chrome DevTools, which now shows live LCP, INP and CLS as you browse
Lab tools can’t fully measure INP because no real user is interacting, so they use Total Blocking Time (TBT) as a stand-in. A high TBT usually predicts a poor INP.
How to Improve LCP
- Optimize your LCP image. Serve it in a modern format like WebP or AVIF, compress it and size it correctly for each screen with
srcset. - Don’t lazy-load the hero image. Lazy loading is great below the fold, but the LCP image should load immediately. Add
fetchpriority="high"to tell the browser it’s important. - Improve server response time. Quality hosting, server-side caching and a content delivery network (CDN) such as Cloudflare reduce TTFB.
- Remove render-blocking resources. Inline critical CSS, defer non-essential JavaScript and limit the number of web fonts.
- Preload key resources. Preloading the hero image or main font can shave hundreds of milliseconds.
How to Improve INP
- Audit your JavaScript. Remove plugins, widgets and tags you don’t need. Every third-party script competes for the main thread.
- Break up long tasks. Developers can split heavy work into smaller chunks and yield to the main thread so the browser can respond to input.
- Defer non-critical scripts. Load chat widgets, analytics extras and social embeds after the page becomes interactive or on user interaction.
- Simplify the DOM. Very large pages with thousands of elements take longer to update after every interaction.
- Give visual feedback quickly. Show a pressed state or spinner immediately, then do the heavy work.
How to Improve CLS
- Always set width and height on images and videos, or use the CSS
aspect-ratioproperty, so the browser reserves space. - Reserve space for ads, embeds and iframes with a fixed-size container.
- Avoid inserting content above existing content, such as cookie banners that push the page down. Overlay them instead.
- Load fonts carefully. Use
font-display: swapwith fallback fonts that have similar metrics, or use thesize-adjustdescriptor to reduce shifts. - Use CSS transforms for animations instead of properties that trigger layout, like
toporheight.
Core Web Vitals for WordPress Sites
WordPress powers a huge share of the web, and many of its performance problems are predictable. Practical steps include:
- Use a lightweight, well-coded theme rather than one loaded with features you don’t use.
- Install a caching plugin such as LiteSpeed Cache, WP Rocket or W3 Total Cache, depending on your server.
- Compress and convert images to WebP on upload.
- Limit page builder add-ons and remove unused plugins.
- Keep PHP up to date. Newer PHP versions are significantly faster than older ones.
- Use a CDN for static files.
How Much Do Core Web Vitals Affect Rankings?
This is where expectations need managing. Google has stated clearly that page experience is one of many signals, and that a page with highly relevant, helpful content can still rank well with mediocre vitals. Improving CLS from 0.15 to 0.05 won’t push a thin page to the top of a competitive search.
But Core Web Vitals matter beyond rankings. Faster, more stable pages reduce bounce rates, increase pages per session and improve conversion rates. Studies from Google and retailers have repeatedly shown that every second of delay costs engagement and sales. Treat good vitals as a business improvement that also supports SEO.
A Simple Core Web Vitals Workflow
- Open the Core Web Vitals report in Google Search Console and note which URL groups fail on mobile.
- Run a representative URL from each group through PageSpeed Insights.
- Identify the failing metric and check the diagnostics for its main cause.
- Fix the issue on the template, not just one page, so the whole group benefits.
- Validate the fix in Search Console and wait for the 28-day field data window to update.
Common Core Web Vitals Myths
“A Lighthouse score of 100 means I pass.” Not necessarily. Lighthouse is a lab test on a simulated device. Google’s assessment uses field data from real visitors, who may be on slower phones and networks than your test. A page can score 95 in Lighthouse and still fail INP in the field.
“Core Web Vitals are measured per site.” They’re assessed per page, although Search Console groups similar URLs together. One slow template, such as product pages or blog posts with heavy embeds, can fail while the rest of the site passes.
“Desktop scores are what matter.” Google uses mobile-first indexing, and most sites receive the majority of traffic from phones. Mobile field data is usually where problems show up first, so prioritize it.
“Only developers can fix this.” Many of the biggest wins are content and configuration decisions: compressing images before upload, removing unused plugins, choosing fewer fonts and avoiding pop-ups that shift the layout. Editors and marketers influence vitals every time they publish.
“Once fixed, always fixed.” New plugins, marketing tags, ad placements and design changes can quietly undo your progress. Check the Core Web Vitals report monthly and treat performance as an ongoing habit, not a one-time project.
Set a Performance Budget
A performance budget is a simple agreement about limits your pages shouldn’t exceed, such as a maximum total page weight of 1.5 MB, no more than 300 KB of JavaScript or an LCP target of 2 seconds on a mid-range phone. Budgets make performance part of every design and marketing decision instead of an emergency clean-up, and tools like Lighthouse CI can warn your team automatically when a change breaks the budget.
Final Thoughts
Core Web Vitals give you a shared language for user experience: load fast, respond quickly and stay still. Most sites can pass with a handful of focused fixes to images, JavaScript and layout reservations. The payoff is a site that feels better to use, converts more visitors and gives search engines one less reason to prefer a competitor.
Not sure why your pages are failing? Book a free SEO audit and we’ll pinpoint the fixes that will move your scores fastest.
Frequently Asked Questions
Quick answers to the questions we hear most about Core Web Vitals.
Are Core Web Vitals a ranking factor?
Yes, Core Web Vitals are part of the page experience signals Google uses in ranking. However, Google has said that great content relevant to the search still wins over page experience. Think of good vitals as a tiebreaker and a user experience win, not a shortcut to the top.
What is a good Core Web Vitals score?
A page passes when, at the 75th percentile of real user visits, Largest Contentful Paint is 2.5 seconds or less, Interaction to Next Paint is 200 milliseconds or less and Cumulative Layout Shift is 0.1 or less.
Why do PageSpeed Insights lab and field scores differ?
Lab data comes from a single simulated test on a fixed device and connection. Field data comes from the Chrome User Experience Report and reflects real visitors on many devices and networks. Google uses field data for its page experience assessment.
What replaced First Input Delay?
Interaction to Next Paint (INP) replaced First Input Delay as a Core Web Vital on March 12, 2024. INP measures the responsiveness of all interactions during a visit, not just the first one.
How long does it take for Core Web Vitals improvements to show?
Field data in the Chrome User Experience Report is based on a rolling 28-day window, so it usually takes about four weeks for improvements to be fully reflected in Search Console and PageSpeed Insights.
Do Core Web Vitals matter for small websites?
Yes. Small sites often depend on mobile visitors with slower connections, and a fast, stable site improves conversions and user satisfaction regardless of size. Field data may be unavailable for low-traffic pages, but the lab tools still show what to fix.